Modelling a Heart Rate Monitor in LabView
Overview
Pre-lab assignment for data acquisition course titled “EE 3810 – Sensors and Data Acquisition” taught by Dr. Deborah Won.
Design Objective
Build a LabView VI which reads in the impedance change signal from the Vernier hand grip sensors and then:
– computes the heart rate in beats per minute
– displays the heart rate value
– detects when the heart rate goes out of range (either too high or too low)
– alerts the user when the heart rate goes out of range
Design Approach
Naturally, a heart rate higher than 180 bpm is abnormal and so is a heart rate below 40 bpm.
Thus, the out-of-range boundary limits can be defined as <40 bpm and >180 bpm.
To model a heart rate, the sinusoidal functional is used with a normalized amplitude of 1.
We let the amplitude threshold limit for the sine function be 0.9. In practice, this value would be the voltage of a pulse obtained from an EKG.
Since a sine wave (and human pulse) is oscillatory, the amplitude remains above our threshold for a certain time.
We can model a signal in time-domain as a square wave representing the binary value on whether or not the amplitude at any given point in time being above the threshold limit.
For each oscillatory cycle, the pulse counter should only need to register the amplitude exceeding the threshold once (only when the value changes from 0 to 1). As a result, a value of 1 should be registered if its previous value is 0 and ignored if it is 1.
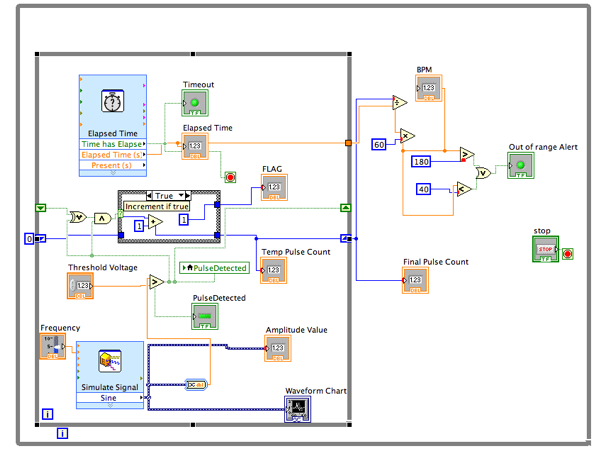
The XOR function can model the output of a pulse change on both the rising edge and the falling edge (where the previous value is different from the current value).
| Previous Sample Value | Current Sample Value | Pulse Detected Output (XOR) |
| 0 | 0 | 0 |
| 0 | 1 | 1 (Rising Edge) |
| 1 | 0 | 1 (Falling Edge) |
| 1 | 1 | 0 |
To isolate the rising edge from the falling edge, the AND function will compare the current value (PulseDetected) and the previous sample value, resulting in a 1 ONLY at the rising edge.
| Previous PulseDetected Value | Current PulseDetected Value | Output (AND) |
| 0 | 0 | 0 |
| 0 | 1 | 0 |
| 1 | 0 | 0 (Falling Edge) |
| 1 | 1 | 1 (Rising Edge) |
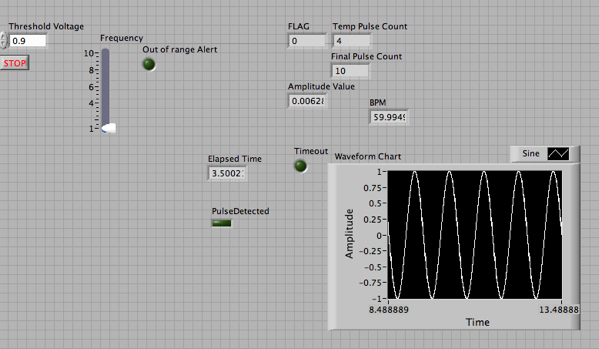
In LabView, we define the user inputs and outputs as the following:
INPUTS
– frequency of sine function (adjustable)
– threshold voltage (set to 0.9 in this case)
OUTPUTS
– Waveform
– BPM calculation
– Out of Range Error LED indicator
Internally, we can define variables used in the Shift Register to access previously stored information about the previous iteration.
SHIFT REGISTERS
– pulseCount (total pulses counted for all iterations within time segment)
– previousPulseDetected (boolean value on whether amplitude exceeds threshold for previous iteration)
Algorithm in Pseudocode
set frequency of sinx
LOOP EVERY 10 seconds
if (amplitude > threshold voltage){
set PulseDetected = 1
pass PulseDetected to shift register as previousPulseDetected
//prepare boolean value for the rising edge detection (according to logic)
_tmp= xor(shiftRegister (_previousPulseDetected, PulseDetected)
_ans = AND(_tmp, PulseDetected)
//check whether pulse should update the current pulse count (rising edge only)
if(_ans == 1){
pulseCount = pulseCount + 1;
FLAG = 1
}else{
FLAG = 0
}
pass pulseCount to shiftRegister as pulseCount
}
after 10 seconds up, pass count and elapsed time
//calculate bpm based on 10 second sample
_rate = pulseCount / elapsed time
_bpm = _rate * 60
//check boundaries and set error accordingly
OutOfRangeAlert = AND(_bpm>180, _bpm<40 );
Example
An input frequency of 1HZ should result in 1 beat per second.
In 1 minute, the calculation should result in 60 bpm.
LabView Block Diagram


Downloads
LabView VI File Available on GitHub